90 days of independent uptime data: 44 services, 426 lost minutes
UptimeProject measures cloud providers, CDNs, DNS resolvers, package registries and AI APIs from the outside. Five probes on separate networks run the same checks a user would, most of them every minute, and a minute counts as up only when a strict majority of probes succeed. Nothing here is self-reported by a provider, and no provider pays for placement. The rules are on the methodology page.
The leaderboard has now run long enough to say something. This post covers the 44 services measured continuously for the 90 days to 12 November 2026.
Most services lost nothing
Each service was measured for roughly 129,000 minutes. Our own coverage gaps, minutes where fewer than three probes could vote, came to at most 7 per service, so the figures below are not flattered by missing data.
- 29 of the 44 lost no minutes at all. Not a down minute, not a degraded one.
- 38 finished at 99.99% or better.
- Only one fell below 99.9%: Linode, at 99.83%.
- Four services account for 368 of the 426 lost minutes: Linode, GitLab, GitHub and Quad9.
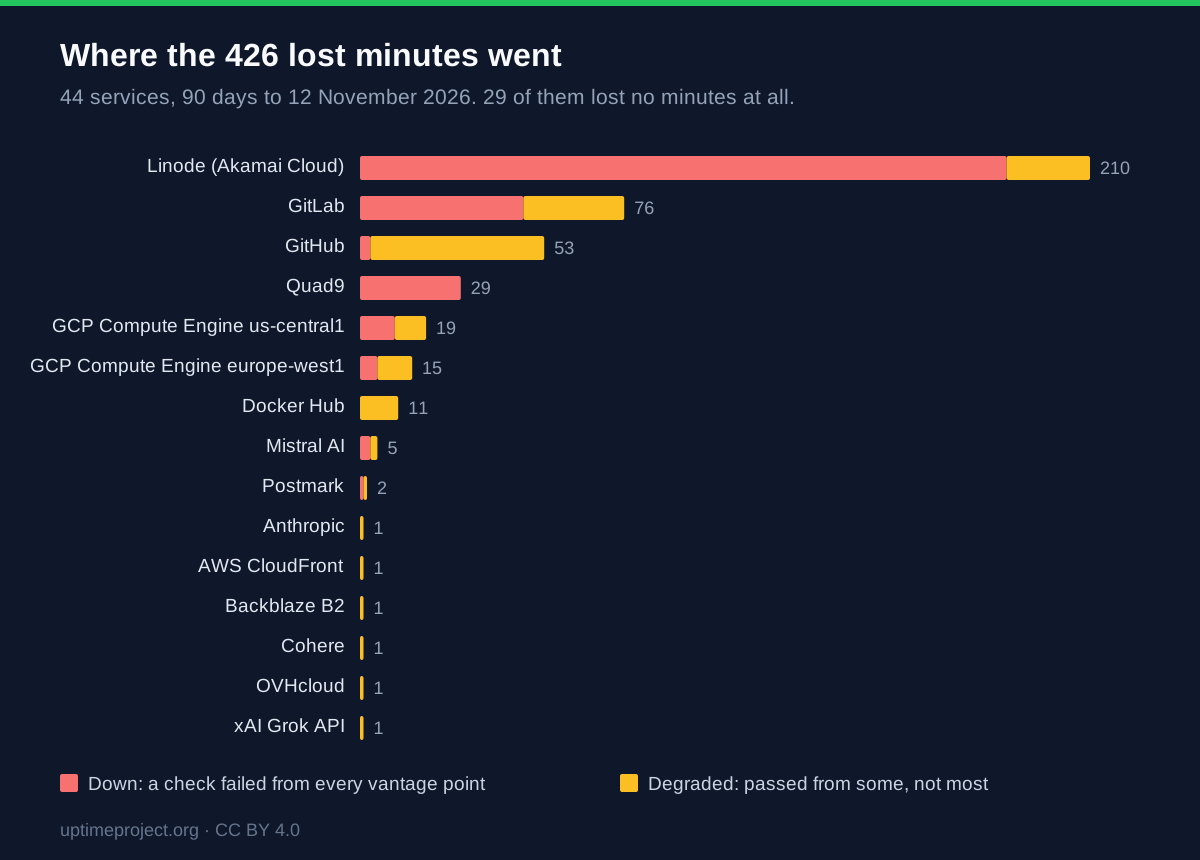
The twenty-nine services at zero are tied, and they will stay tied until one of them has a bad day. Ninety days is enough to find the services that fail. It is not enough to rank the ones that don’t.
Two ways to lose time
Linode lost 210 minutes. GitHub lost 53. The way they lost those minutes has almost nothing in common.
Linode lost 172 of its 210 minutes in two long outages, and both were on the calendar. On 19 August, from 04:23 to 05:29 UTC, every probe failed for 66 consecutive minutes, inside a maintenance window Linode had announced six weeks earlier: API and Cloud Manager offline from 04:00 to 05:30 UTC. The same maintenance came round on 28 October and cost 106 minutes between 03:55 and 05:44 UTC, overrunning its window at both ends; October 2026 in data has the detail. Most of the rest came on 7 September, when six short incidents landed between 10:19 and 12:00 UTC.
GitHub was almost never down. Only 3 of its 53 minutes were down minutes; the other 50 were degraded, meaning some probes reached it and others did not. Its incident log has 14 entries in the window, none longer than 6 minutes, and 13 of them never got past degraded. Four of the 14 fell on the morning of 8 November, between 10:49 and 11:47 UTC.
A degraded minute is a partial failure: whether a request worked depended on where it came from. A status page, or a monitor running from one location, has two options for a morning like GitHub’s 8 November: call it an outage, or miss it. The per-probe vote is what lets it show up as what it was.
The ranking puts them on the same board. It does not say that one lost its time to two announced windows on its API, and the other to a scattering of brief partial failures. What 99.99% uptime actually buys you argues that a monthly percentage hides exactly this difference. Here it is in measured data.
The other two
- GitLab lost 76 minutes across 8 incidents. The largest began at 22:53 UTC on 24 September and lasted 42 minutes, followed by two shorter degraded spells before midnight.
- Quad9 lost 29 minutes in three outages of 9 to 10 minutes each. Every one of those minutes was down and none was degraded: when the resolver failed, it failed from every probe at once. Two of the outages came within 20 minutes of each other on 8 September; the third started at 02:17 UTC on 14 October.
What this does not measure
These are outside-in observations of public endpoints. They say whether a service answered the same request from five places. They do not see your workload, your region’s control plane, or an internal incident that never reaches the public surface. A probe hosted on the measured provider’s own network does not vote on it.
The endpoint chosen for each check matters more than it looks. An audit of our own registry found services that could not have recorded an outage at all, which is written up in The endpoint you monitor decides the outage you can detect.
Using the data
- The leaderboard and the per-category pages rank every service by 30-day availability, and refresh in the browser on every visit.
- Each service page has its incident history, per-probe status, the checks behind its figure, and a badge you can embed in a README.
- The public API serves everything above as JSON, with Atom feeds for incidents. An
MCP server at
https://mcp.uptimeproject.org/mcpexposes the same data to AI agents. - All measurements are published under CC BY 4.0.
New posts and methodology changes go out by newsletter and RSS.
If a service you depend on is missing, or a figure here looks wrong, open an issue on GitHub or write to hello [at] uptimeproject [dot] org.
New posts and methodology changes, by email. Subscribe