October 2026 in data: the longest outage was on the calendar
October’s figures, from the same five probes and the same rules as everything else on the site (methodology). This covers the 46 services measured for the whole month. Ten more joined the registry on 23 October and wait for a full month before they appear in a roundup.
The month in numbers
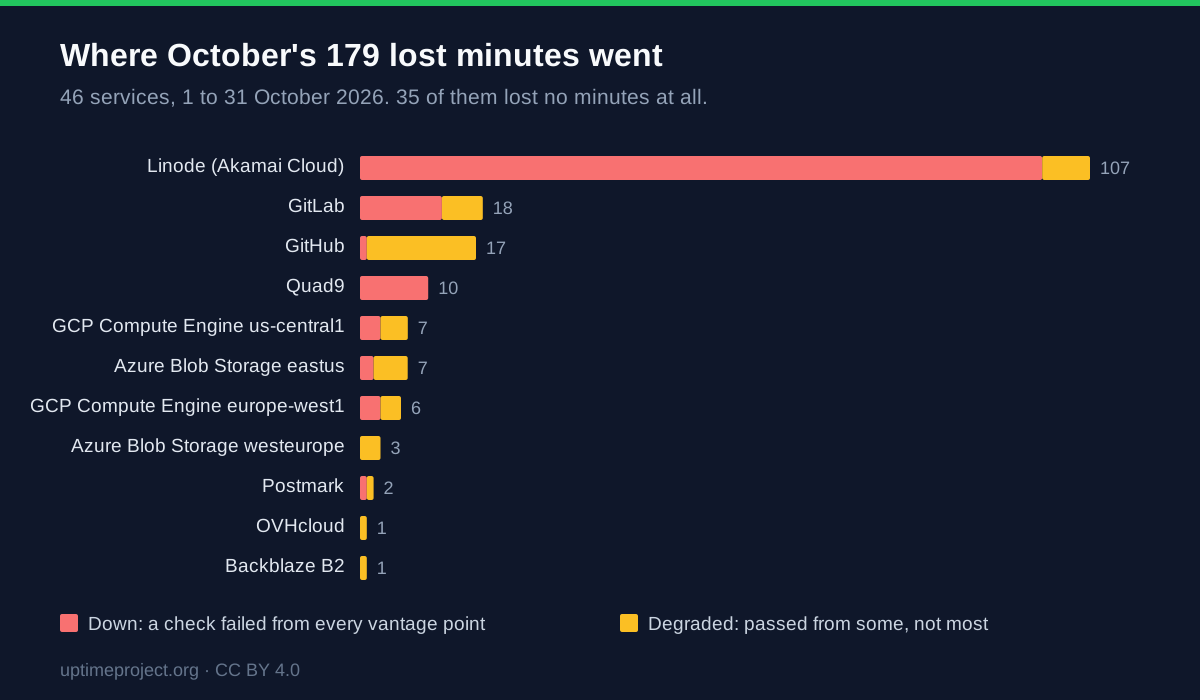
- 35 of 46 services lost no minutes at all.
- 179 minutes were lost in total, across 11 services.
- One service, Linode, accounts for 107 of them.
- Our own coverage gaps, minutes where fewer than three probes could vote, came to at most 2 per service.
Linode: announced, then overrun
On 29 September Linode posted a scheduled maintenance for 28 October, 04:00 to 05:30 UTC. The notice said Cloud Manager, the API and the CLI would be offline, and that running Linodes would not be affected.
Our Linode check calls api.linode.com/v4/regions, so it measures exactly the part that was
announced to go offline. What the probes saw:
- First failed minute at 03:55 UTC, five minutes before the window opened.
- Back up at 05:44 UTC, 14 minutes after the window closed. Linode marked the maintenance complete at 05:30.
- 106 bad minutes inside a 109-minute incident: 99 down, 7 degraded.
It was not the first time. Linode’s 66-minute outage on 19 August, from 04:23 to 05:29 UTC, sat inside an announced window for the same systems, also 04:00 to 05:30. That one finished on time.
Our figures do not exclude announced maintenance. A request to the API at 04:30 failed whether or not it was on a calendar, and the leaderboard reports whether services answered. The notice still mattered: anyone who read it could plan around 90 minutes. Nobody could plan around the 19 that fell outside it.
It is also the control-plane case from What 99.99% uptime actually buys you. The API was down for nearly two hours while, by Linode’s account, every running server stayed up. Linode’s figure on our leaderboard describes its API, not its servers.
GitHub: one match, one miss
On 1 October our probes opened GitHub incidents at 13:04 and 13:23 UTC. GitHub’s own incident summary describes “two periods of slow page loads and intermittent request failures” between 13:04 and 13:34 UTC. The start time matches to the minute. GitHub’s first status post went up at 13:37, after both periods had ended.
On 7 October it went the other way. GitHub had two write outages, 15:06 to 15:16 and 16:52 to 17:01 UTC, in which “actions that save or change data failed” across git, pull requests, issues, Actions and the API. Our probes recorded one degraded minute that day.
Both of our GitHub checks are reads: a static file from the web front door, and the first step of an
anonymous git fetch from a public repository. Reads kept working, so the probes had nothing to
see. This is the limit The endpoint you monitor decides the outage you can
detect is about. Measuring writes
needs an authenticated check, which we do not run today.
The rest
- GitLab lost 18 minutes in two incidents: 11 minutes from 07:02 UTC on 13 October, and 7 minutes from 16:02 UTC on 16 October.
- Quad9 lost 10 minutes in a single outage from 02:17 UTC on 14 October. All ten were down minutes: the resolver failed from every probe at once.
- GCP Compute Engine had three incidents of 2 to 3 minutes in one week, across both measured regions: us-central1 on 15 and 21 October, europe-west1 on 17 October.
- Postmark lost 2 minutes on 15 October.
Minutes that never became incidents
Azure Blob Storage lost 10 minutes in October, 7 in eastus and 3 in westeurope, spread over seven different days. None of them appears on the incidents page. An incident is a run of at least two bad minutes, with gaps of up to two minutes bridged, and Azure’s bad minutes never came close enough together to form one. OVHcloud and Backblaze B2 each lost a single isolated minute.
Those minutes still count against availability. They just never produce an entry in the incident list or its feed.
The data
- Every figure above comes from the public API: daily buckets from
/v1/services/{id}/uptime?period=90d, incidents from/v1/incidents. - The incidents page and its Atom feed list every incident as it happens.
- All measurements are published under CC BY 4.0.
New posts and methodology changes go out by newsletter and RSS.
If a figure here looks wrong, open an issue on GitHub or write to hello [at] uptimeproject [dot] org.
New posts and methodology changes, by email. Subscribe